Standard Forecasting Analysis
The Calgary Regional Transportation Model (RTM), managed by the Growth Infrastructure Planning Division, is used for many types of travel studies. These include studying how people move across the city, checking traffic patterns in specific areas, and predicting traffic on certain roads. The standard forecasting analysis is based on City-wide forecasts, called the Scenario Series.
-
Start your forecasting request
To request a Transportation Forecasting Analysis, please fill out the forecasting request form.
Important: All RTM results must be reviewed and adjusted before they are used in any study.
Link Volume Forecast
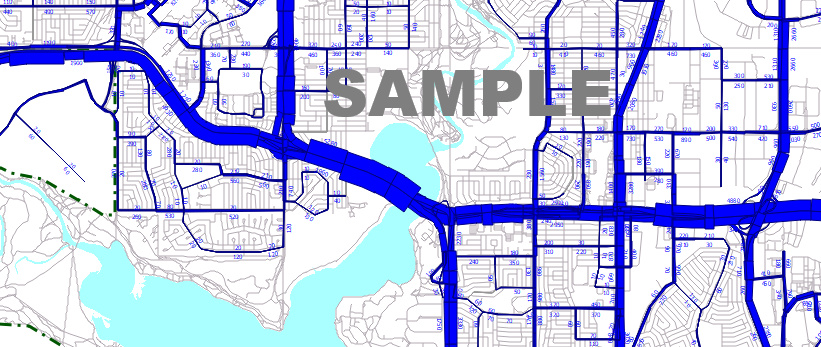
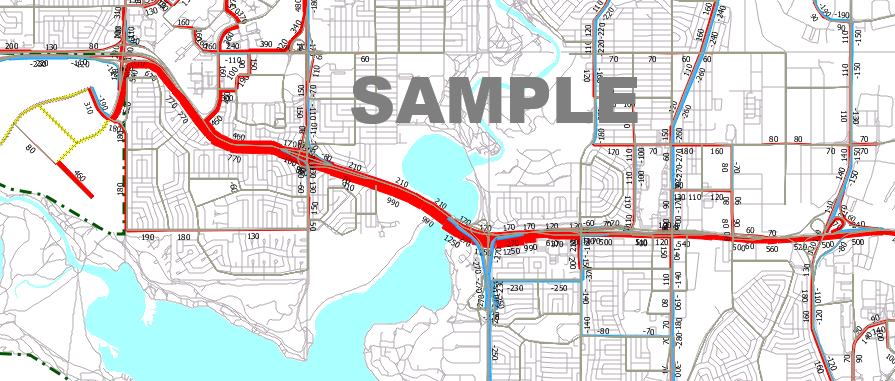
The Link Volume Forecast is a PDF plot showing forecasted traffic volumes on roads (called “links”) for the busiest morning and afternoon hours, as well as the average daily traffic (ADT).
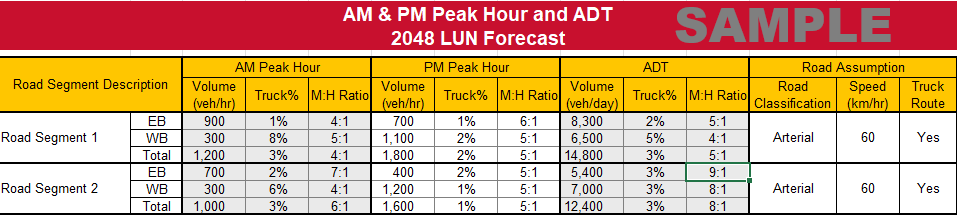
The Noise Study Link Volume Forecast is prepared specifically for noise studies. It is provided in Excel format and includes the percentage of trucks and the ratio of medium to heavy trucks. The forecast lists assumptions from the scenario series about road type, speed limits, and truck routes for the chosen locations and time periods.
Note: Road class, truck routes, and speed limits in the model are assumptions. They may not match real road plans. Always check actual road class, speed limit, and truck route information yourself.
Examples
Traffic Volume Difference
The Traffic Volume Difference analysis shows the difference in vehicle volumes between two scenarios, such as different years or different road design options. It helps transportation engineers and planners make informed decisions about infrastructure development and management.
Format: PDF maps
Example
Turn Volume Forecast
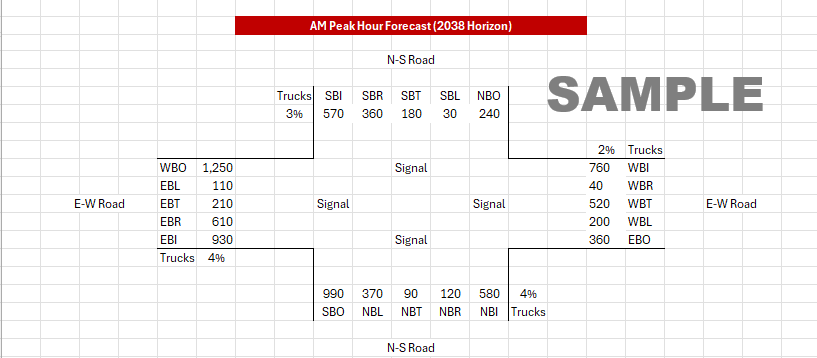
The Turn Volume Forecast shows traffic numbers for intersections and interchanges during the busiest morning and afternoon hours, including turning and through movements. It also includes the percentage of truck traffic. These results are usually reviewed and adjusted by comparing recent traffic counts to the base year of the scenario series. This analysis is best for big-picture planning, not detailed intersection analysis.
Note: The RTM is a demand model. Turn movements do not represent realistic capacity for individual turns or intersection controls. Manual review and sensitivity analysis are highly recommended.
Example
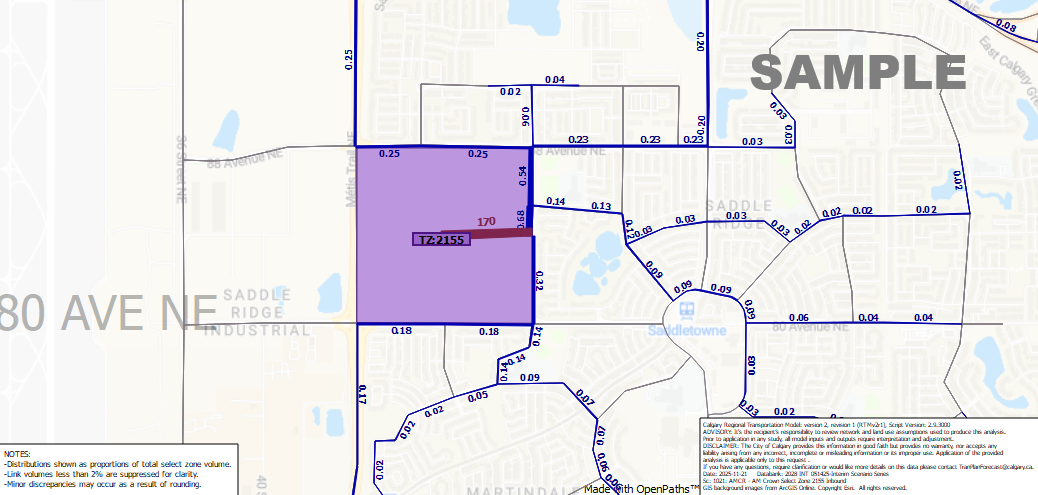
Select Zone
A Select Zone report includes PDF maps for the busiest morning and afternoon hours. These maps show the routes vehicles use when leaving or entering a zone.
Example
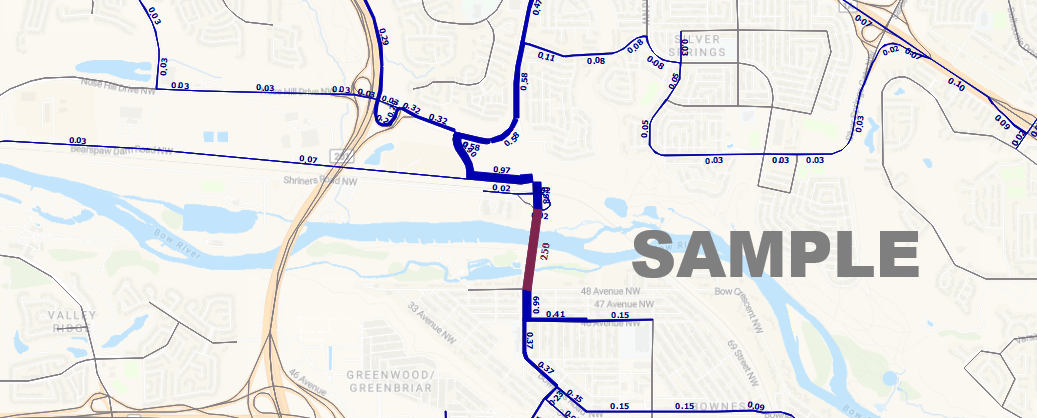
Select Link
The Select Link analysis includes PDF maps for the busiest morning and afternoon hours. The maps show how vehicle trips are distributed when entering or leaving a specific section of road, called a “link.”
Example
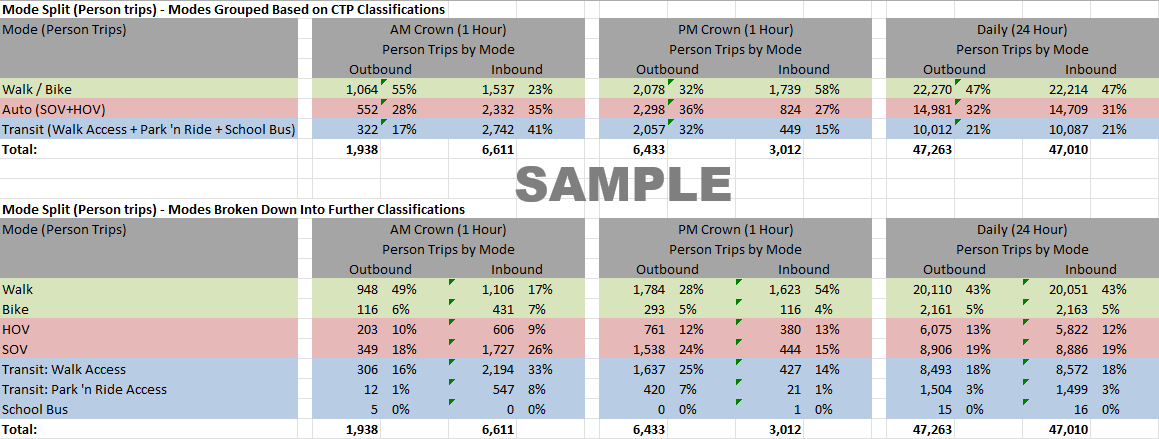
Mode Split
The Mode Split analysis shows the percentage of travellers using different travel modes during the busiest morning and afternoon hours, as well as over a full day. It focuses on a specific transportation zone or study area. Other time periods, like a 3-hour peak or midday, can be added if requested. The analysis includes trips going in and out of the study area. Travel modes include walking, biking, transit, high-occupancy vehicles (HOV), and single-occupant vehicles (SOV).
Example
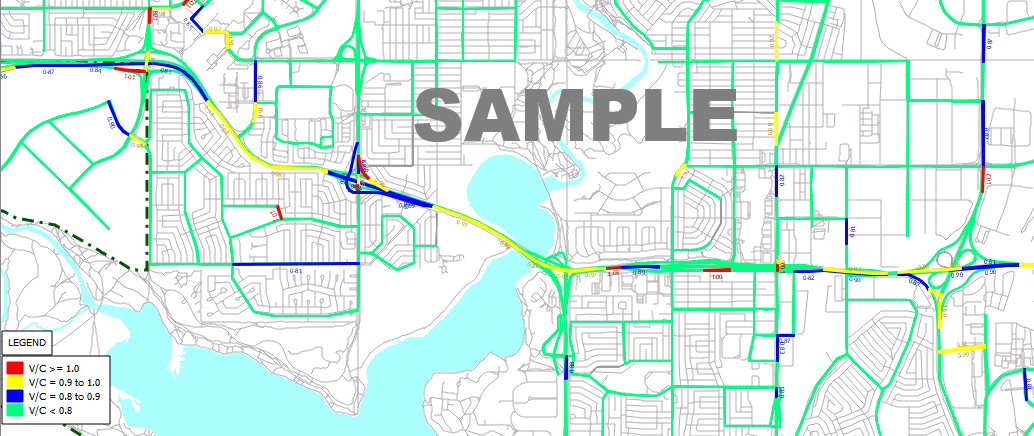
Volume Over Capacity Plot
The Volume Over Capacity Plot shows the ratio between forecasted traffic and the theoretical maximum traffic a road can carry under ideal conditions. This relationship is important for planning and managing transportation systems to reduce congestion and make the best use of resources.
Example
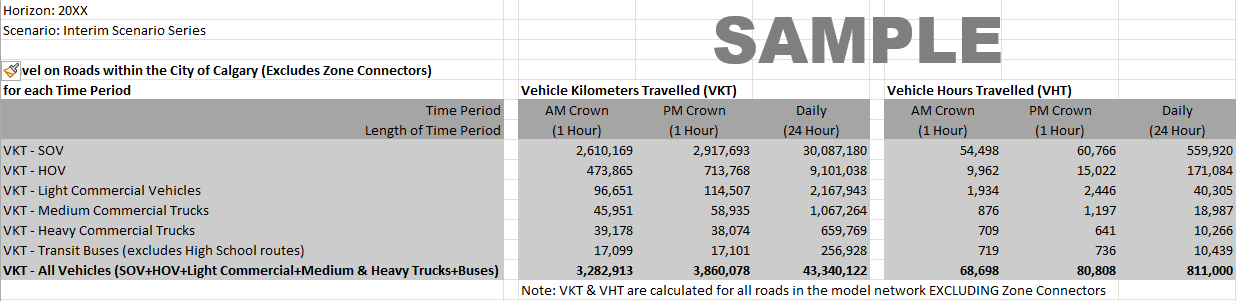
Vehicle Kilometers and Vehicle Hours Travelled
Vehicle Kilometers Travelled (VKT) and Vehicle Hours Travelled (VHT) measure total forecasted traffic within an area and how it changes over time.
- VKT = number of vehicles x road length during a time period
- VHT = VKT ÷ average speed during the same time period
These measures help plan and manage transportation systems. Reports can be created for different vehicle types (SOV, HOV, trucks, transit buses) and time periods (busiest hour or daily totals).
Example
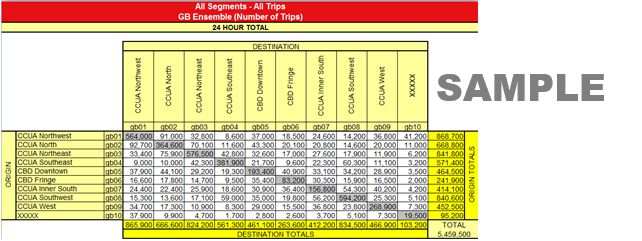
Origin – Destination Matrix
The Origin – Destination Matrix analysis creates a table showing the number of trips between different zones or groups of zones. Individual zones are often combined into larger groups based on study needs.
Example
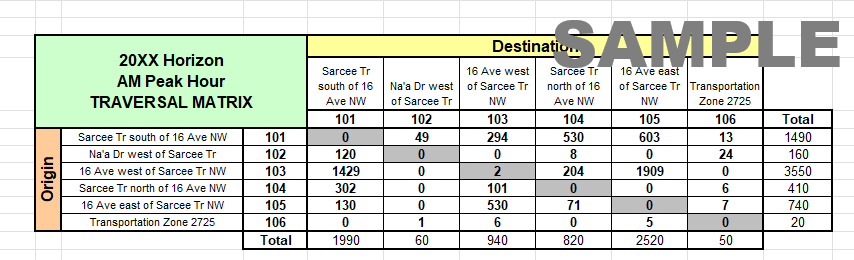
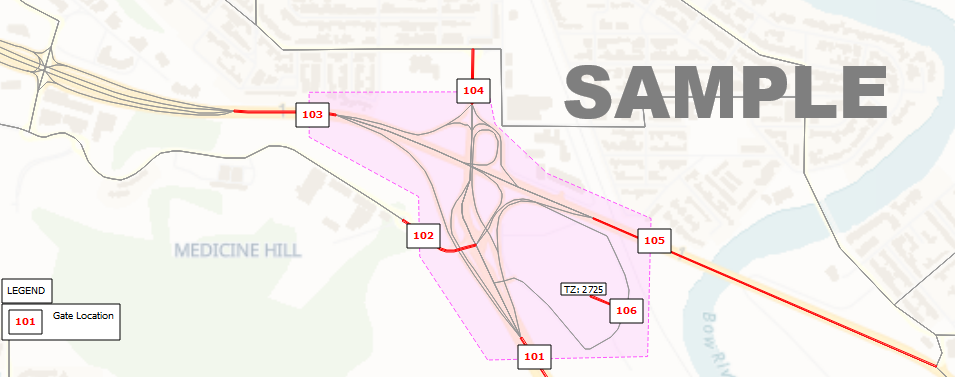
Traversal Matrix
A Traversal Matrix, provided in Excel format, shows where travellers enter and exit a selected area. These points are usually on roads crossing into and out of the area. The study area can be a single road section (for corridor studies) or a larger sub-area within the RTM, which can then be used for micro-simulation analysis (high-resolution traffic operations analysis).
Example