Active transportation data
Every day, Calgarians walk, cycle, roll, and ride using bikes, e‑scooters, skateboards, and other active ways of getting around. The City of Calgary collects data on these active modes of transportation to better understand how, where and when people move through our city. This information helps us plan safer streets, improve our pathways and bikeways, support everyday trips, and track how travel patterns change over time.
Bicycle counts
Bicycle counts
Although called bicycle counts, with the increasing number of other modes of transportation such as scooters, e-scooters and e-bikes, this data includes any mode that wheels. Counts are collected by detecting bicycles and scooters with loops embedded in the pavement. The data provides a breakdown of the number of cyclists on a daily, weekly, monthly and yearly basis.
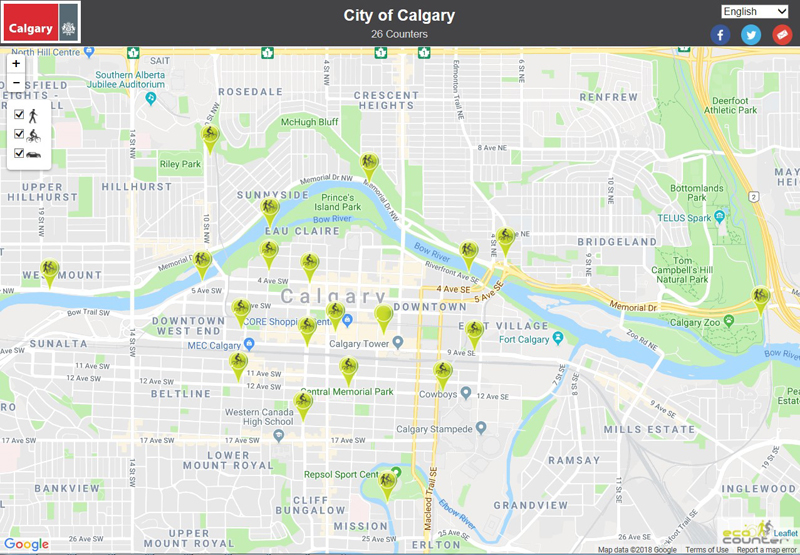
Click here for the live, interactive map
The City’s bicycle counters are placed in locations that minimize interference from adjacent traffic and electromagnetic radiation.
Regional pathway volume map
Regional pathway volume map
Calgary has one of the largest urban pathway networks in North America, with more than 1,000 kilometres of connected pathways. Understanding how people use this network helps The City plan, manage and improve pathways over time.
This map shows how people use Calgary’s pathway network, based on data collected in 2025. It includes both people walking and people cycling on pathways across the city.
This is a new map and is the first step in showing where and how often people use pathways, and how activity flows through the network.
Regional pathways volume maps
Pedestrian activity map
Pedestrian activity map
These maps show where people are walking across Calgary, using pedestrian count data collected between 2022 and 2025. It gives a citywide overview of where walking activity is highest.
Pedestrian counts are shown at intersections and combine data from different times of day on a typical weekday. This helps show general walking patterns, rather than exact numbers at one specific time.
These maps are used to:
- Show where people are walking across the city
- Highlight areas with more walking activity
- Support long‑term transportation planning and analysis
This map is not meant for detailed design or day‑to‑day operations. It is intended to give a big‑picture view of pedestrian activity across Calgary.
Downtown pedestrian activity maps (2022-25)
Downtown Cordon Study
Active modes
Downtown Cordon Study
Active modes
Every year in May, The City conducts the Central Business District (CBD) cordon count.
This data shows how people travel into and out of downtown Calgary, including people walking, cycling, and using other active modes.
Counts are collected at about 31 locations around the CBD over a three-week period.
The CBD cordon surrounds downtown with:
- The Bow River to the north
- CP railway tracks to the south
- 11 Street S.W. to the west
- The Elbow River in the east.
To explore our data sets in more detail, visit The City's Open Data Portal.
| Modes | AM Peak (7:15 a.m. – 8:15 a.m.) Inbound | AM Peak (8:00 a.m. - 9:00 a.m.) Outbound | PM Peak (5:00 p.m. - 6:00 p.m.) Inbound | PM Peak (4:00 p.m. – 5:00 p.m.) Outbound | 16 Hour (6 am – 10 p.m.) Inbound | 16 Hour (6 a.m. – 10 p.m.) Outbound |
|---|---|---|---|---|---|---|
| Modes : Passenger vehicles | AM Peak (7:15 a.m. – 8:15 a.m.) Inbound : 48.3% | AM Peak (8:00 a.m. - 9:00 a.m.) Outbound : 51.2% | PM Peak (5:00 p.m. - 6:00 p.m.) Inbound : 54.8% | PM Peak (4:00 p.m. – 5:00 p.m.) Outbound : 46.3% | 16 Hour (6 am – 10 p.m.) Inbound : 58.5% | 16 Hour (6 a.m. – 10 p.m.) Outbound : 58.6% |
| Modes : Transit | AM Peak (7:15 a.m. – 8:15 a.m.) Inbound : 43.6% | AM Peak (8:00 a.m. - 9:00 a.m.) Outbound : 40.2% | PM Peak (5:00 p.m. - 6:00 p.m.) Inbound : 32.2% | PM Peak (4:00 p.m. – 5:00 p.m.) Outbound : 40.9% | 16 Hour (6 am – 10 p.m.) Inbound : 30.1% | 16 Hour (6 a.m. – 10 p.m.) Outbound : 29% |
| Modes : Pedestrian | AM Peak (7:15 a.m. – 8:15 a.m.) Inbound : 6.4% | AM Peak (8:00 a.m. - 9:00 a.m.) Outbound : 7.8% | PM Peak (5:00 p.m. - 6:00 p.m.) Inbound : 11.1% | PM Peak (4:00 p.m. – 5:00 p.m.) Outbound : 10.3% | 16 Hour (6 am – 10 p.m.) Inbound : 9.6% | 16 Hour (6 a.m. – 10 p.m.) Outbound : 10.4% |
| Modes : Cyclists | AM Peak (7:15 a.m. – 8:15 a.m.) Inbound : 1.7% | AM Peak (8:00 a.m. - 9:00 a.m.) Outbound : 0.8% | PM Peak (5:00 p.m. - 6:00 p.m.) Inbound : 1.9% | PM Peak (4:00 p.m. – 5:00 p.m.) Outbound : 2.5% | 16 Hour (6 am – 10 p.m.) Inbound : 1.8% | 16 Hour (6 a.m. – 10 p.m.) Outbound : 2% |
|
Modes
:
Total |
AM Peak
(7:15 a.m. – 8:15 a.m.)
Inbound
:
47,000 |
AM Peak (8:00 a.m. - 9:00 a.m.)
Outbound
:
19,000 |
PM Peak
(5:00 p.m. - 6:00 p.m.)
Inbound
:
24,000 |
PM Peak
(4:00 p.m. – 5:00 p.m.)
Outbound
:
48,000 |
16 Hour
(6 am – 10 p.m.)
Inbound
:
311,000 |
16 Hour
(6 a.m. – 10 p.m.)
Outbound
:
298,000 |