Combined modes of transportation data
Calgary’s combined transportation data brings a fuller picture of how people move in our city, whether they’re travelling into the downtown core, or making every-day trips in their own communities. By looking at long-term counts and survey data, we can see how travel habits change, where transportation networks are working and where there is work to be done. The information helps The City plan for a better connected Calgary.
Traffic Counts
Calgary Traffic Count System
Traffic Counts
Calgary Traffic Count System
For more than 40 years, The City of Calgary has been gathering information about how people travel. Today, all that information lives in one easy-to-use online tool called the Calgary Traffic Count System (CalTRACS).
CalTRACS helps us understand how our city is changing and how we can plan for a safer, smoother and more connected Calgary.
What CalTRACS shows you
CalTRACS combines decades of transportation data so anyone can explore. You can find data such as:
- How people walk, bike or drive through an intersection
- How many vehicles use a street and how fast they are travelling
- How many people use crosswalks
- What types of vehicles are on our roads (cars, trucks, bikes, motorcycles, etc.)
Why does this data matter? This data helps us understand how Calgarians are moving. With this information, we can make better decisions for our City.
CalTRACS helps:
- Identify travel trends in communities
- Support planning for sidewalks, bike lanes and road improvements
- Guide long-term transportation planning
- Give residents a clearer picture of what is happening in their neighbourhoods
All data can be viewed through Quick View summaries, or you can download full reports in PDF or Excel formats. Everything is free to access under The City’s Open Government License.
Questions?
If you have questions about the data in CalTRACS, how different City business units use this data or require online support, please contact 311 or submit your feedback in an online service request.
Downtown Cordon Study
All modes
Downtown Cordon Study
All modes
Each Spring, The City of Calgary takes a close look at how Calgarians travel in and out of our downtown area. These studies help us understand how our city is growing and changing to support the people who live, work and visit here.
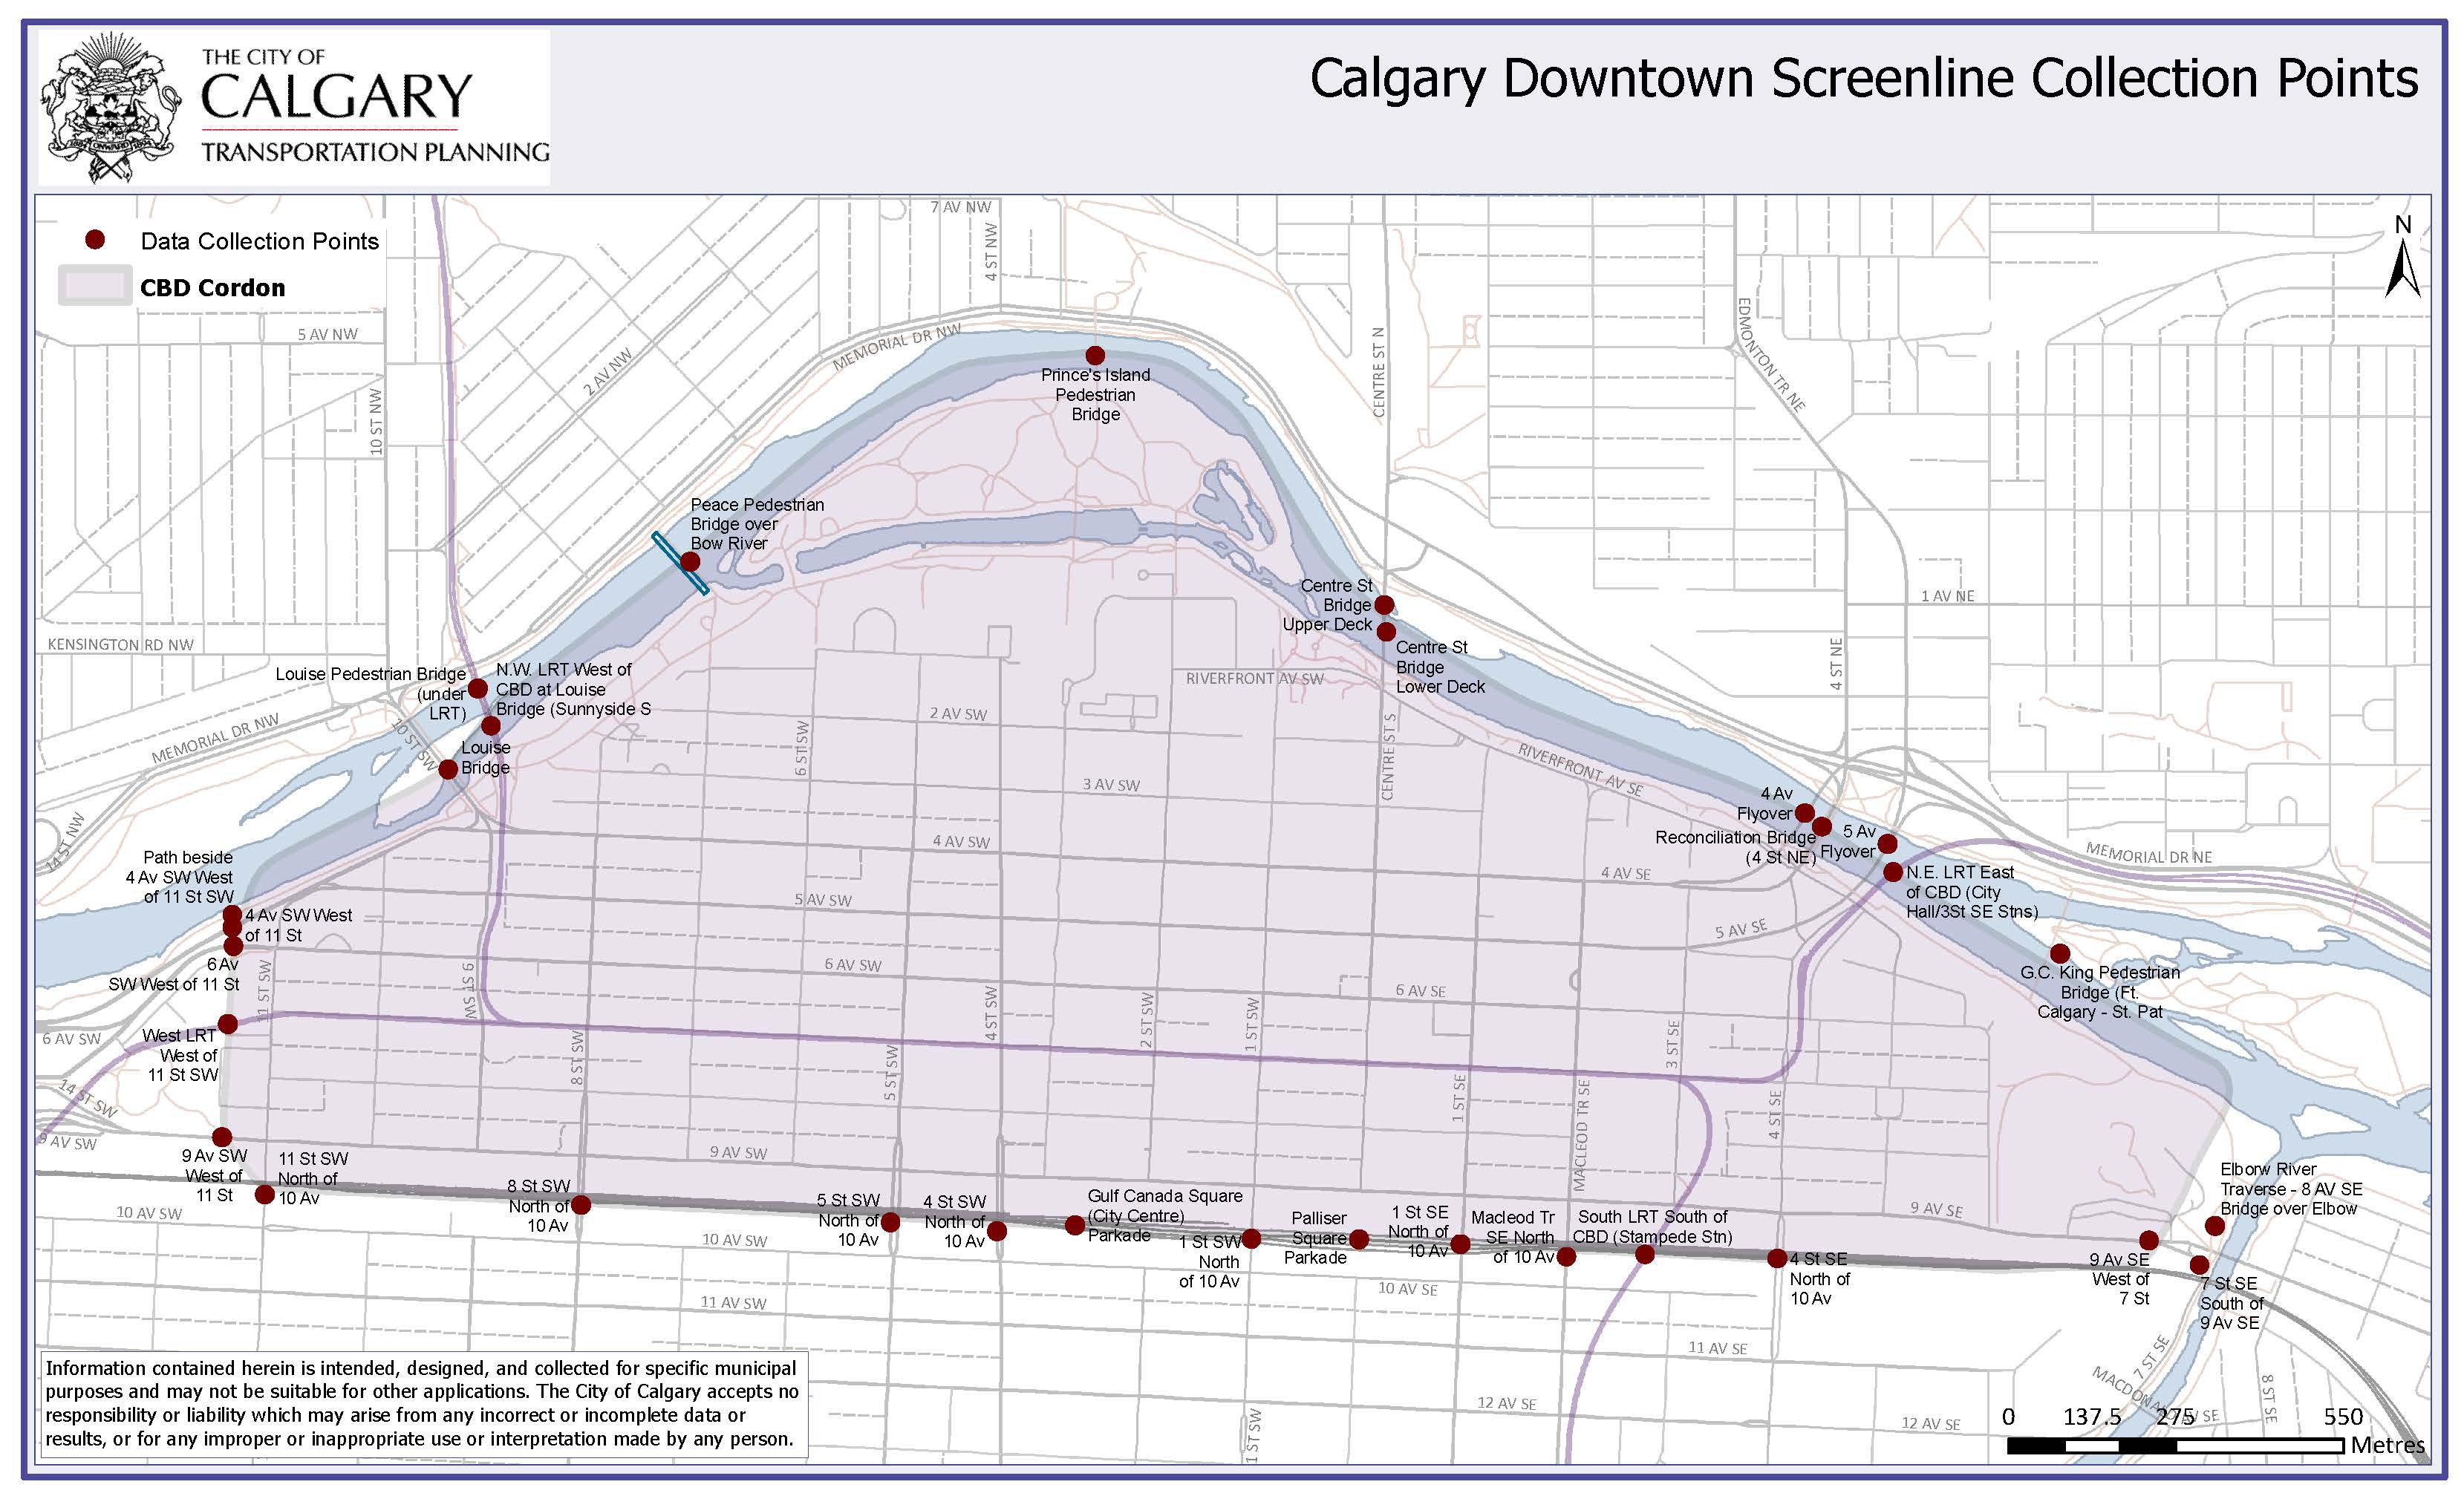
To do so, The City looks at the Central Business District (CBD) cordon count. This cordon is an invisible boundary of downtown, bordered by the Bow River in the north, the railway tracks in the south, 11 St S.W. in the west and the Elbow River in the east. Any one who crosses this boundary, by foot, bike, transit or car, becomes part of this study of how Calgary moves.
What this data tells us:
- How many people come downtown each day
- What travel choices they are making
- How these patterns change over time
This information helps us plan safer streets, better transit service and a downtown that works for everyone. Download the Central Business District (CBD) Cordon Count summary and the full 2024 modal split summary to learn more.
Calgary Downtown Cordon Activity Modal Split
To explore our data sets in more detail, visit The City's Open Data Portal.
Below is the modal split table for 2024 that shows yearly cordon studies. These tables demonstrate the percentage of people using different modes of travel during busy times of day and across the full 16-hour count period, whether by car, transit, foot or bike.
Note: This information is collected for municipal planning, and so it may not be suitable for other uses. The City is not responsible or liable for situations which may arise from any incorrect or incomplete data or results, or for any improper or inappropriate use or interpretation made by any person.
| Modes | AM Peak (7:15 a.m. – 8:15 a.m.) Inbound | AM Peak (8:00 a.m. - 9:00 a.m.) Outbound | PM Peak (5:00 p.m. - 6:00 p.m.) Inbound | PM Peak (4:00 p.m. – 5:00 p.m.) Outbound | 16 Hour (6 am – 10 p.m.) Inbound | 16 Hour (6 a.m. – 10 p.m.) Outbound |
|---|---|---|---|---|---|---|
| Modes : Passenger vehicles | AM Peak (7:15 a.m. – 8:15 a.m.) Inbound : 48.3% | AM Peak (8:00 a.m. - 9:00 a.m.) Outbound : 51.2% | PM Peak (5:00 p.m. - 6:00 p.m.) Inbound : 54.8% | PM Peak (4:00 p.m. – 5:00 p.m.) Outbound : 46.3% | 16 Hour (6 am – 10 p.m.) Inbound : 58.5% | 16 Hour (6 a.m. – 10 p.m.) Outbound : 58.6% |
| Modes : Transit | AM Peak (7:15 a.m. – 8:15 a.m.) Inbound : 43.6% | AM Peak (8:00 a.m. - 9:00 a.m.) Outbound : 40.2% | PM Peak (5:00 p.m. - 6:00 p.m.) Inbound : 32.2% | PM Peak (4:00 p.m. – 5:00 p.m.) Outbound : 40.9% | 16 Hour (6 am – 10 p.m.) Inbound : 30.1% | 16 Hour (6 a.m. – 10 p.m.) Outbound : 29% |
| Modes : Pedestrian | AM Peak (7:15 a.m. – 8:15 a.m.) Inbound : 6.4% | AM Peak (8:00 a.m. - 9:00 a.m.) Outbound : 7.8% | PM Peak (5:00 p.m. - 6:00 p.m.) Inbound : 11.1% | PM Peak (4:00 p.m. – 5:00 p.m.) Outbound : 10.3% | 16 Hour (6 am – 10 p.m.) Inbound : 9.6% | 16 Hour (6 a.m. – 10 p.m.) Outbound : 10.4% |
| Modes : Cyclists | AM Peak (7:15 a.m. – 8:15 a.m.) Inbound : 1.7% | AM Peak (8:00 a.m. - 9:00 a.m.) Outbound : 0.8% | PM Peak (5:00 p.m. - 6:00 p.m.) Inbound : 1.9% | PM Peak (4:00 p.m. – 5:00 p.m.) Outbound : 2.5% | 16 Hour (6 am – 10 p.m.) Inbound : 1.8% | 16 Hour (6 a.m. – 10 p.m.) Outbound : 2% |
|
Modes
:
Total |
AM Peak
(7:15 a.m. – 8:15 a.m.)
Inbound
:
47,000 |
AM Peak (8:00 a.m. - 9:00 a.m.)
Outbound
:
19,000 |
PM Peak
(5:00 p.m. - 6:00 p.m.)
Inbound
:
24,000 |
PM Peak
(4:00 p.m. – 5:00 p.m.)
Outbound
:
48,000 |
16 Hour
(6 am – 10 p.m.)
Inbound
:
311,000 |
16 Hour
(6 a.m. – 10 p.m.)
Outbound
:
298,000 |
Travel surveys
My Travel Log
Travel surveys
My Travel Log
The My Travel Log Survey helps us learn how Calgarians get around—whether you’re walking to school, driving to work, taking transit or biking to meet friends. By sharing details about daily trips, participants help The City understand real travel habits across different seasons, neighbourhoods and lifestyles.
Participation helps shape safer streets, better transit service and a better connected transportation network. Every response adds to a clearer picture of our city’s needs today and helps us plan for tomorrow’s Calgary.