

Water quality, water hardness and water data
Water quality, hardness and data
We take the responsibility of providing clean, safe water to Calgarians very seriously. Conversely, we must also ensure that the water returning to our rivers, via our stormwater or our wastewater, is equally clean and safe.
Top
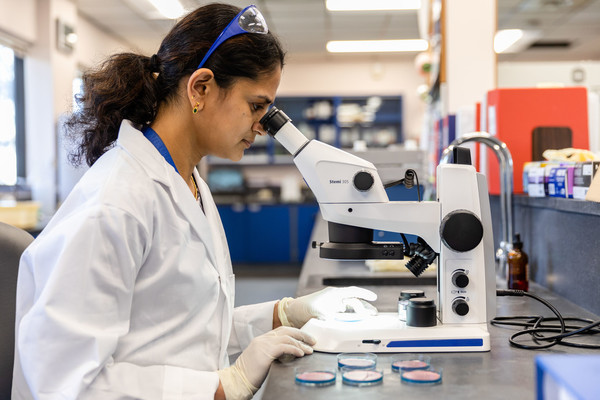
The City’s Water Quality and Regulatory Assurance (WQRA) division provides scientific, technical and regulatory services to the utility protecting the environment, public health and City infrastructure. The management and staff of WQRA are committed to high-quality professional practices through continual improvement ensuring the quality of its services and accuracy of the analytical testing.
The City of Calgary WQRA laboratories are accredited for those tests listed on the Scope of Testing through the Canadian Association for Laboratory Accreditation (CALA) to ensure we meet and maintain the requirements of the ISO/IEC 17025:2017(E). WQRA laboratories produce data of high quality through accurate and reliable testing. Calgarians can be assured that our water is safe and high quality.
| 2021 | 2022 | 2023 | 2024 | 2025 | |
|---|---|---|---|---|---|
|
Number of tests completed for drinking water line of service |
2021: 127136 | 2022: 142206 | 2023: 137456 | 2024: 171754 | 2025: 208736 |
Water hardness
Calgary's water is considered hard because of the amount of calcium and magnesium in the water from the Bow and Elbow Rivers.
What is water hardness?
Water hardness is caused by calcium and magnesium in the ground and surface water. These minerals come from rock such as limestone that dissolves in our river system. The results of having hard water can include difficulty making lather or suds while washing and/or a build-up of minerals on taps and other fixtures.
How hard is Calgary's water?
The hardness of Calgary's water varies seasonally and by location:
- The Bow and Elbow Rivers each have different hardness levels.
- The lowest hardness levels are typically during spring snowmelt and the highest. hardness levels are between December and February.
Generally, people in the northern half of the city receive water from the Bow River through the Bearspaw Water Treatment Plant. Residents in the south receive most of their water from the Elbow River through the Glenmore Water Treatment Plant.
Water Hardness, mg/L CaCO3
| January to March | April to June | July to September | October to December | |
|---|---|---|---|---|
| Bearspaw range |
January to March:
151-200 |
April to June:
141-192 |
July to September:
151-177 |
October to December:
168-197 |
| Glenmore range |
January to March:
208-274 |
April to June:
181-245 |
July to September:
191-216 |
October to December:
213-248 |
*ranges for 2025
Are there health issues with water hardness?
There are no known health effects associated with calcium and magnesium minerals in drinking water. However, conventional water softening systems (those that use salts) may not be suitable for people on sodium-reduced diets.
We recommend that consumers thoroughly research the various water softener systems available before deciding whether or not to soften their water.
For more information on water hardness please see the Canadian drinking water quality guidelines.
Water quality summaries
Key drinking water quality parameters from January to December 2025
Basic water chemistry
| Water quality parameter | Units | Drinking water results | Limit | Major source |
|---|---|---|---|---|
| Water quality parameter : Color | Units : CU |
Drinking water results
:
<2.0 – 3.2 |
Limit
:
≤15a |
Major source : Erosion of natural deposits in watershed. |
| Water quality parameter : Hardness as CaCO3 | Units : mg/L |
Drinking water results
:
141 - 274 |
Limit : No limit | Major source : Erosion of natural deposits in watershed. |
| Water quality parameter : pH | Units : pH Units |
Drinking water results
:
7.1 - 8.0 |
Limit
:
7.0 - 10.5b |
Major source : Influenced by the dissolved minerals in the water, temperature, and water treatment processes. |
| Water quality parameter : Temperature | Units : °C |
Drinking water results
:
1.0 - 20.0 |
Limit
:
≤15°Ca |
Major source : River water temperature. |
| Water quality parameter : Total dissolved solids | Units : mg/L |
Drinking water results
:
195 - 310 |
Limit
:
≤500a |
Major source : Erosion of natural deposits in watershed. |
| Water quality parameter : Turbidity | Units : NTU |
Drinking water results
:
<0.05 – 0.10 |
Limit : <1.0 | Major source : Suspended particles in water. |
Inorganic substances
| Water quality Parameter | Units | Drinking water results | Limit | Major source |
|---|---|---|---|---|
| Water quality Parameter: Aluminum | Units : mg/L |
Drinking water results:
0.027 - 0.180 |
Limit :
0.1b,c |
Major source:
Water treatment process |
| Water quality Parameter: Arsenic | Units : mg/L | Drinking water results: <0.0005 | Limit : 0.01 | Major source: Erosion of natural deposits in watershed. |
| Water quality Parameter: Barium | Units : mg/L |
Drinking water results:
0.026 - 0.114 |
Limit : 2.0 | Major source: Erosion of natural deposits in watershed. |
| Water quality Parameter: Cadmium | Units : mg/L | Drinking water results: <0.00015 | Limit : 0.007 | Major source: Erosion of natural deposits in watershed. |
| Water quality Parameter: Calcium | Units : mg/L |
Drinking water results:
37 - 76 |
Limit : No limit | Major source: Erosion of natural deposits in watershed. |
| Water quality Parameter: Chlorine residual, free | Units : mg/L |
Drinking water results:
0.82 - 2.01 |
Limit : ≥0.2 | Major source: Plant treatment. |
| Water quality Parameter: Chromium | Units : mg/L | Drinking water results: <0.0005 | Limit : 0.05 | Major source: Erosion of natural deposits in watershed. |
| Water quality Parameter: Copper | Units : mg/L |
Drinking water results:
<0.0005 – 0.012 |
Limit :
≤ 2 ≤1a |
Major source: Erosion of natural deposits in watershed. Leaching may occur from plumbing (pipes and brass fittings). |
| Water quality Parameter: Fluoride | Units : mg/L |
Drinking water results:
<0.05 - 0.75 |
Limit : 1.5 |
Major source:
Naturally occurring. Water treatment process addition began June 30, 2025. |
| Water quality Parameter: Iron | Units : mg/L | Drinking water results: <0.010 |
Limit :
≤0.1a |
Major source: Erosion of natural deposits in watershed. |
| Water quality Parameter: Lead | Units : mg/L | Drinking water results: <0.0005 | Limit : 0.005 | Major source: Erosion of natural deposits in watershed. Leaching may occur from plumbing (pipes, solders, and brass fittings). |
| Water quality Parameter: Magnesium | Units : mg/L |
Drinking water results:
11 - 21 |
Limit : No limit | Major source: Erosion of natural deposits in watershed. |
| Water quality Parameter: Manganese | Units : mg/L | Drinking water results: <0.0005 – 0.0016 |
Limit :
≤0.12 ≤0.02a |
Major source: Erosion of natural deposits in watershed. |
| Water quality Parameter: Mercury | Units : mg/L |
Drinking water results:
<0.000002 - 0.000003 |
Limit : 0.001 | Major source: Erosion of natural deposits in watershed. |
| Water quality Parameter: Nickel | Units : mg/L |
Drinking water results:
<0.0005 – 0.0010 |
Limit : No limit | Major source: Erosion of natural deposits in watershed. Leaching may occur from plumbing (pipes, solders, and brass fittings) |
| Water quality Parameter: Nitrate as Nitrogen | Units : mg/L | Drinking water results: <0.005 – 0.153 | Limit : 10 | Major source: Erosion of natural deposits in watershed. |
| Water quality Parameter: Nitrite as Nitrogen | Units : mg/L | Drinking water results: <0.005 | Limit : 1 | Major source: Erosion of natural deposits in watershed. |
| Water quality Parameter: Potassium | Units : mg/L |
Drinking water results:
0.4 – 1.4 |
Limit : No limit | Major source: Erosion of natural deposits in watershed. |
| Water quality Parameter: Sodium | Units : mg/L |
Drinking water results:
3.4 – 12 |
Limit :
≤200a |
Major source: Erosion of natural deposits in watershed. |
| Water quality Parameter: Sulfate | Units : mg/L |
Drinking water results:
45 – 91 |
Limit :
≤500a |
Major source: Erosion of natural deposits in watershed. |
| Water quality Parameter: Zinc | Units : mg/L |
Drinking water results:
<0.003 – 0.026 |
Limit :
≤5.0a |
Major source: Erosion of natural deposits in watershed. Leaching may occur from galvanized pipes, hot water tanks and brass fittings. |
Microbiological parameters
| Water quality parameter | Units | Drinking water results | Limit | Major source |
|---|---|---|---|---|
| Water quality parameter: E. coli | Units : MPN/100 mL | Drinking water results: <1 | Limit : 0 | Major source: Domestic animals, wildlife and human waste. |
| Water quality parameter: Total Coliform | Units : MPN/100 mL |
Drinking water results:
<1 |
Limit : 0 | Major source: Soil, domestic animals and wildlife. |
Limit specified by Guidelines for Canadian Drinking Water Quality (Health Canada December 2025) or Alberta Government operating approval for aesthetic, health, and operational rationale.
- CU = Color Units.
- NTU = Nephelometric Turbidity Units, a measure of water clarity.
- MPN = Most-Probable Number.
- mg/L = milligrams per litre, or parts per million (ppm)
- (a) Aesthetic objective
- (b) Limit based on annual average
- (c) Operational guidance objective.
Drinking water data summaries
Have you checked out our open data?
Looking for water quality data not provided on this page or in our Open Data?
*External requests will require a Data sharing agreement.