Calgary river flows - historical data
The City of Calgary collects data of river flows on the Bow and Elbow River. Information on this page provides a historical look at river flows.
Historical flow rates for the Bow and Elbow Rivers
The term 1-in-100 refers to the probability of flooding, meaning there is a one percent chance in any given year that it may flood to the level we saw in 2013.
Below are the annual return period (probability of occurring) flow rates.
| Return period (in years) | Probability of occurrence in any given year (%) | Elbow River above Glenmore Dam (m3/s) | Elbow River below Glenmore Dam (m3/s) | Bow River above Elbow River (m3/s) | Bow River below Elbow River (m3/s) |
|---|---|---|---|---|---|
|
2 |
50% |
74 |
74 |
208 |
271 |
|
5 |
20% |
167 |
150 |
377 |
489 |
|
10 |
10% |
262 |
150 |
595 |
745 |
|
20 |
5% |
268 |
150 |
745 |
895 |
|
50 |
2% |
303 |
150 |
1217 |
1367 |
|
100 |
1% |
369 |
150 |
1710 |
1860 |
|
200 |
0.5% |
690 |
150 |
2435 |
2585 |
|
500 |
0.2% |
1240 |
901 |
3615 |
4015 |
History of maximum flows
Bow River (above the Elbow River)
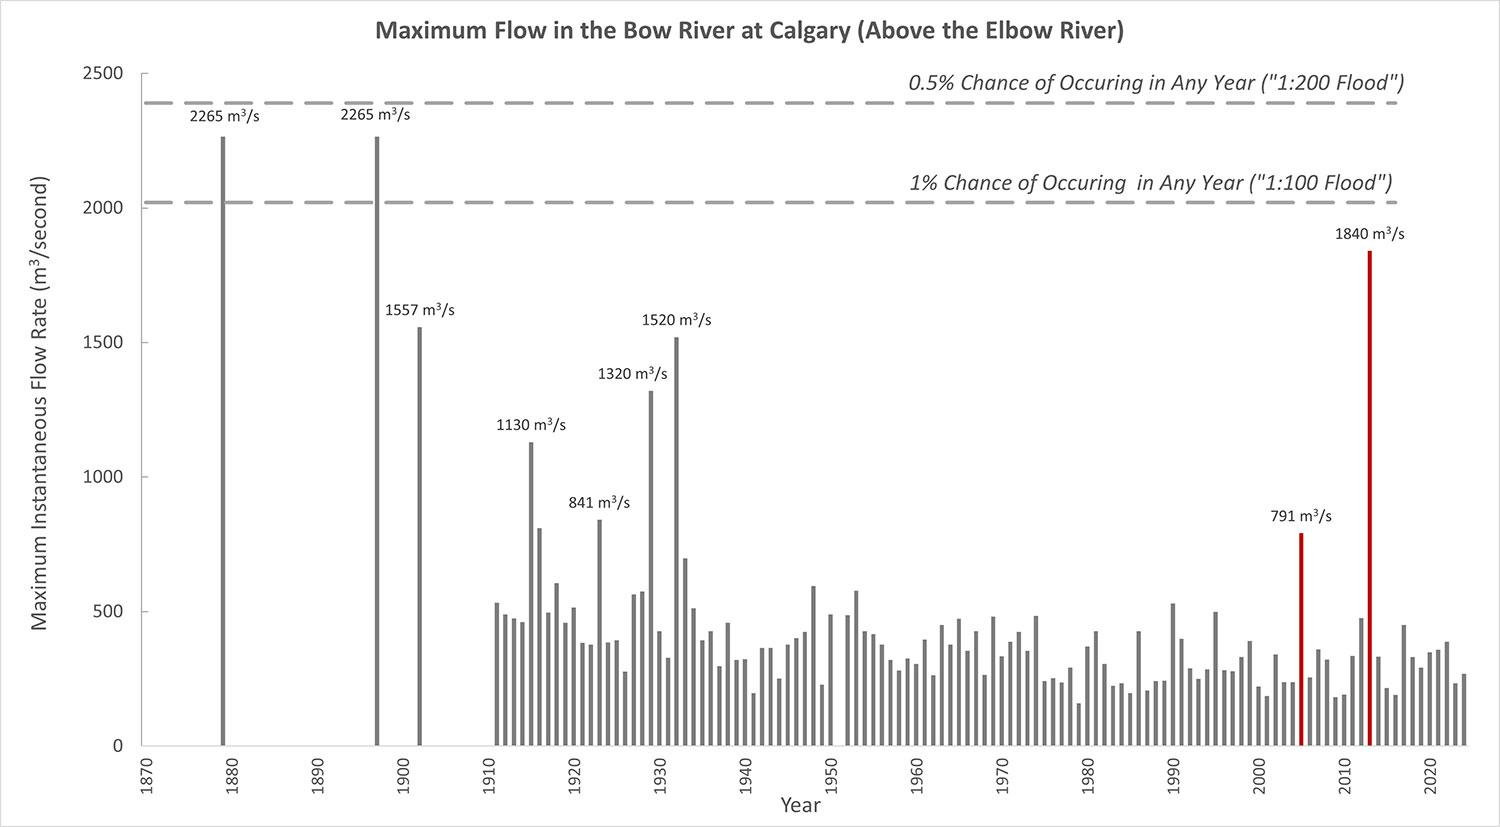
Click to view larger image.
Elbow River (below Glenmore Dam)
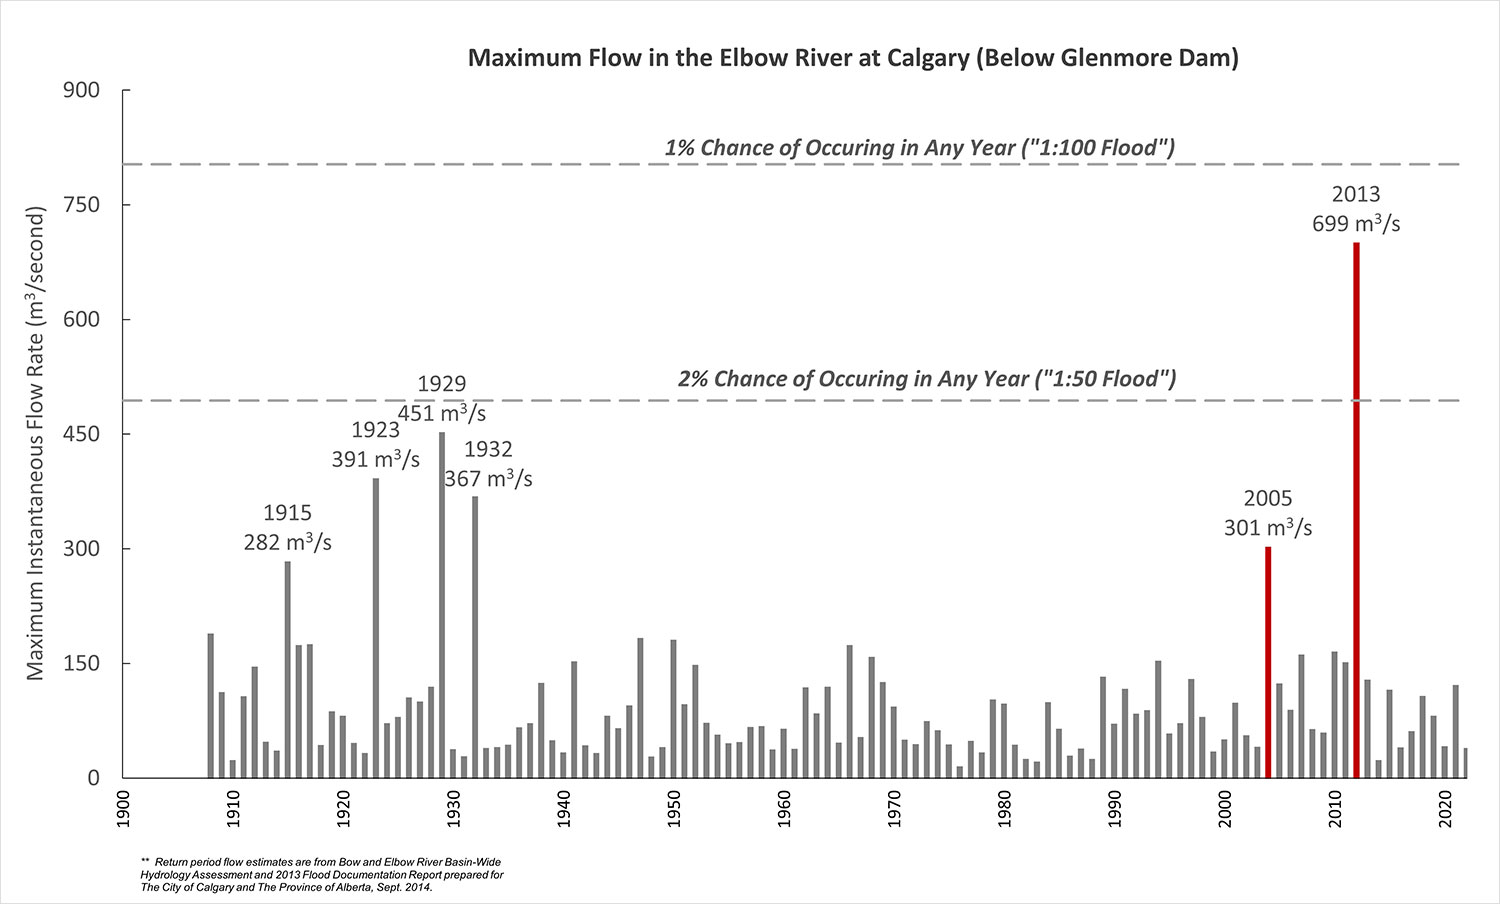
Click to view larger image.
Elbow River (above Glenmore Dam)
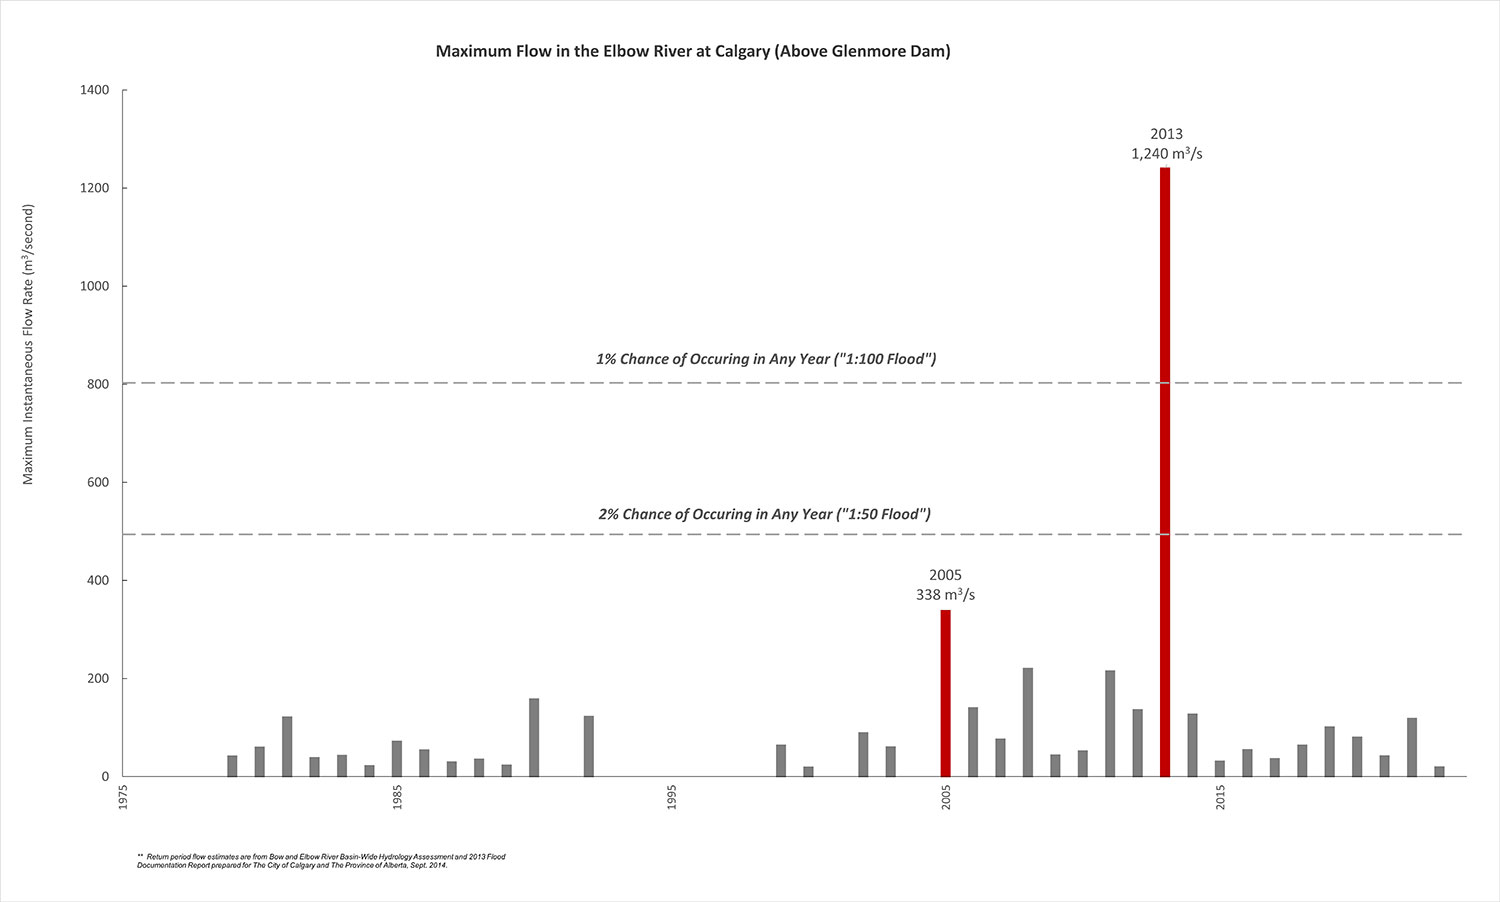
Click to view larger image.